Commodity Inventory Data
Commodity Metal Inventory Data 30 Day LME Warehouse Stocks Level MCX Trend If you liked this article, then please share ...
Read moreDetails

Commodity Metal Inventory Data 30 Day LME Warehouse Stocks Level MCX Trend If you liked this article, then please share ...
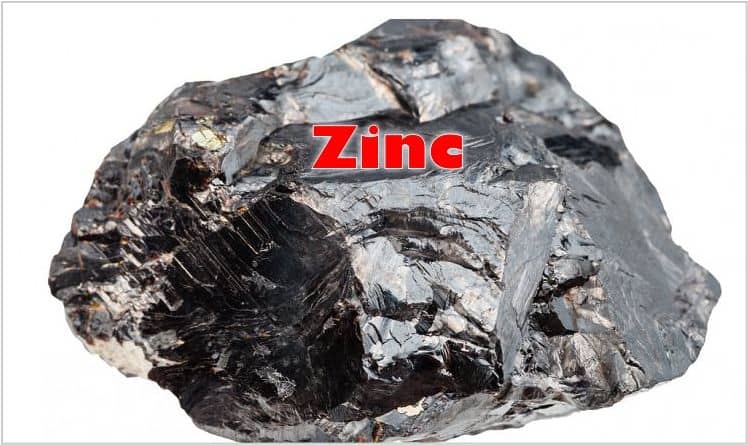
Read moreDetailsAdjacent chart shows the price movement of MCX Zinc continuous contract. The short-term trend has turned bullish as zinc broke ...
Read moreDetailsAdjacent chart shows the price movement of MCX Nickel continuous contract. Nickel saw a sharp fall after witnessing a breakdown ...
Read moreDetailsAdjacent chart shows the price movement of MCX Lead continuous contract. Lead has witnessed a sharp recovery from the low ...
Read moreDetailsAdjacent chart shows the price movement of MCX Zinc continuous contract. MCX Zinc has witnessed a sharp pullback from the ...
Read moreDetailsAdjacent chart shows weekly price movement of MCX Aluminium continuous contract. Aluminium managed to hold above a 78.6% retracement level ...
Read moreDetailsAdjacent chart shows the price movement of MCX Lead continuous contract. Lead witnessed a breakdown from the bear flag pattern ...
Read moreDetailsAdjacent chart shows the price movement of MCX Zinc continuous contract. Zinc closed in green after five days of negative ...
Read moreDetailsAdjacent chart shows the price movement of MCX Nickel continuous contract. Nickel found resistance at the downward sloping trend line ...
Read moreDetailsBelow chart shows the price movement of MCX Zinc continuous contract. MCX Zinc Bears back in action Zinc is forming ...
Read moreDetails


© 2008-2026 SHUBHLAXMI COMMODITY