Silver Shines Bullish Breakout
Silver Shines Bullish Breakout or Overbought Territory?

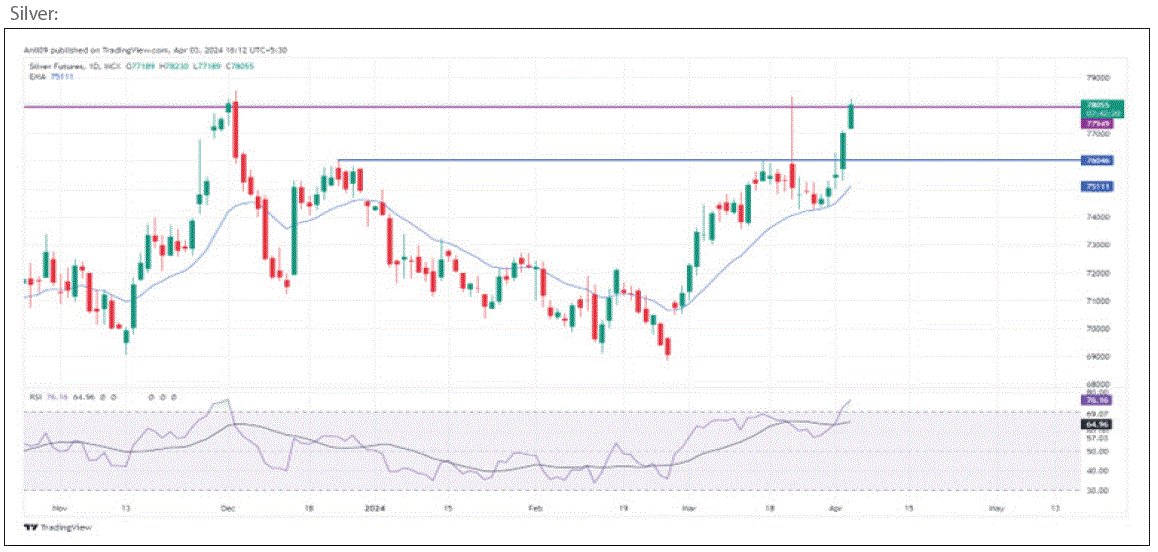
Silver on daily chart gleams with bullish potential. Prices recently surpassed the previous swing high of 78,000 and have held above it, signalling a positive bias. This breakout potentially paves the way for further gains.
Key Levels to Watch:
- Resistance: The next hurdle lies at 78,750/79,000, a crucial resistance zone that could determine the strength of the uptrend.
- Support: Maintaining prices above yesterday’s low is critical to sustain the bullish momentum. A reversal below 77,200 could indicate a potential pullback.
Technical Indicators Align with Bullish Outlook:
- RSI: The Relative Strength Index (RSI) boasts a positive crossover, signifying a shift in momentum towards the upside. However, its movement towards the overbought zone suggests potential caution.
Trading Strategy:
Based on the current technical analysis, a buy on dips strategy could be applicable for the day. This strategy involves entering long positions when prices experience temporary setbacks, targeting a resistance level of 79,000.
 Considerations for Informed Trading:
- Overbought RSI: While the RSI supports the bullish trend, its proximity to the overbought zone indicates Silver might be due for a correction. Be prepared for potential price fluctuations.
- Global Market Sentiment: Silver’s price can be influenced by broader market movements. Watch for economic data releases and geopolitical events that could impact investor risk appetite.
- Confirmation of Breakout: A decisive move above the 78,750/79,000 resistance zones would solidify the bullish trend. Conversely, a sustained drop below 77,200 could signal a trend reversal.
Disclaimer: This analysis is for informational purposes only and should not be considered financial advice. Conduct your own research and due diligence before making any trading decisions.
If you liked this article, then please share it on the social networking site. You can also find us on Twitter, Facebook, YouTube, and Instagram, Telegram.


