

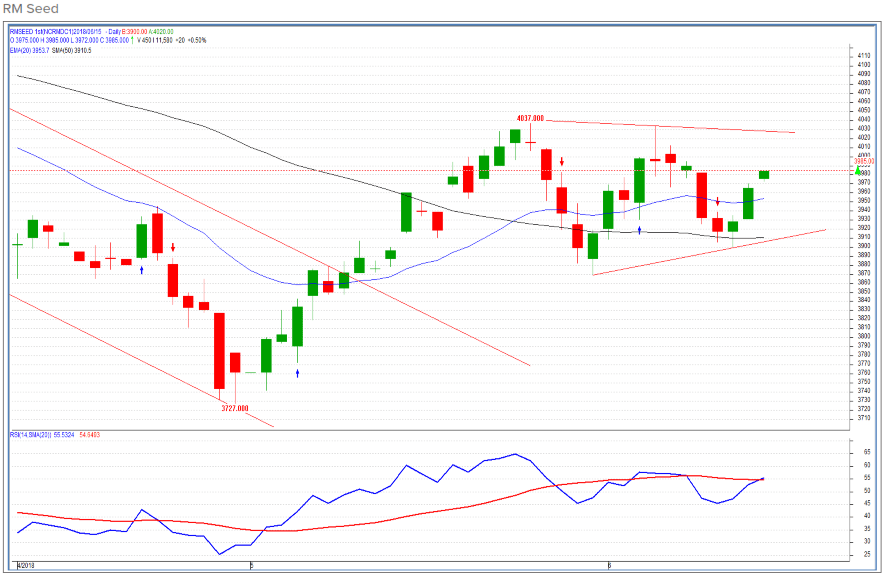
Rm Seed prices moving in a triangle pattern
From the below chart of RM Seed (Continuous contract), prices are moving in a triangle pattern as seen in the above chart. The two trend lines in a triangle pattern converge; in this case, it can be clearly. A move above 4030 will open positive possibilities for this agro-commodity. However, a move below 3900 will be a negative sign. RSI is positively poised and can move higher going ahead. The bias looks positive, but it is important to wait for prices confirmation. A sustainable move above 4030 can take prices higher till 4100 followed by 4150 levels over a short-term
Rm Seed के चार्ट से, कीमतें उपरोक्त चार्ट में देखी गई त्रिकोण पैटर्न में आगे बढ़ रही हैं। एक त्रिभुज पैटर्न में दो प्रवृत्ति लाइनें अभिसरण; इस मामले में, यह स्पष्ट रूप से हो सकता है। 4030 से ऊपर की एक चाल इस कृषि-वस्तु के लिए सकारात्मक संभावनाएं खुल जाएगी। हालांकि, 3900 से नीचे एक कदम नकारात्मक संकेत होगा। आरएसआई सकारात्मक रूप से तैयार है और आगे बढ़ने के लिए आगे बढ़ सकता है। पूर्वाग्रह सकारात्मक दिखता है, लेकिन कीमतों की पुष्टि के लिए प्रतीक्षा करना महत्वपूर्ण है। 4030 से ऊपर एक टिकाऊ कदम 4100 तक बढ़ सकता है और उसके बाद अल्पावधि में 4150 के स्तर बढ़ सकता है


Intraday Range & Trend