

Difference and similarities between Candlestick pattern and Chart pattern
Let’s first compare and understand the difference and similarities between a Candlestick pattern and a Chart pattern
| Candlestick pattern | Chart pattern |
| A mix of one or more candlesticks gives rise to a candlestick pattern. | When the price changes as a result of psychological and fundamental aspects over a long time period, it gives rise to chart pattern. |
| Candlestick patterns appear over a short time span. | The trend direction is shown for a long time span. |
| The trend direction is indicated for a short time span. | The change in trend direction can also be indicated by a chart pattern. |
| This pattern is adapted for short-term entry & exit points. | This pattern is adapted for long-term buying & selling signals. |
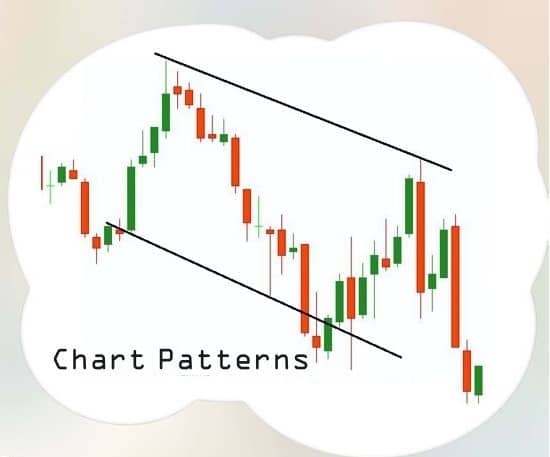
The illustration above shows the candlestick and chart pattern for MCX GOLD PRICE.
We can notice that the daily “supply and demand” factors of gold prices’ give rise to candlestick patterns. The indication of trend direction is for a long time span in chart pattern.
If you liked this article, then please share to the social networking site. You can also find us on Twitter, Facebook, YouTube, Google+ and Instagram, Telegram.
Related Posts


Intraday Range & Trend


