

MCX Nickel Near weekly breakdown
Nickel Near weekly breakdown
Adjacent chart shows the price movement of MCX Nickel continuous contract. Nickel Near weekly breakdown from a rising trend line support in last week’s trade and is sustaining below the same. If it sustains below the trend line, the resulted sell-off can drift Nickel to 945-915 support zone. Immediate resistance is near the 975-984 zone. Nickel would continue to see weakness if it sustains below 984 in coming trading sessions. Weekly chart also spots a negative crossover on the momentum indicator indicating sell on rising structure.
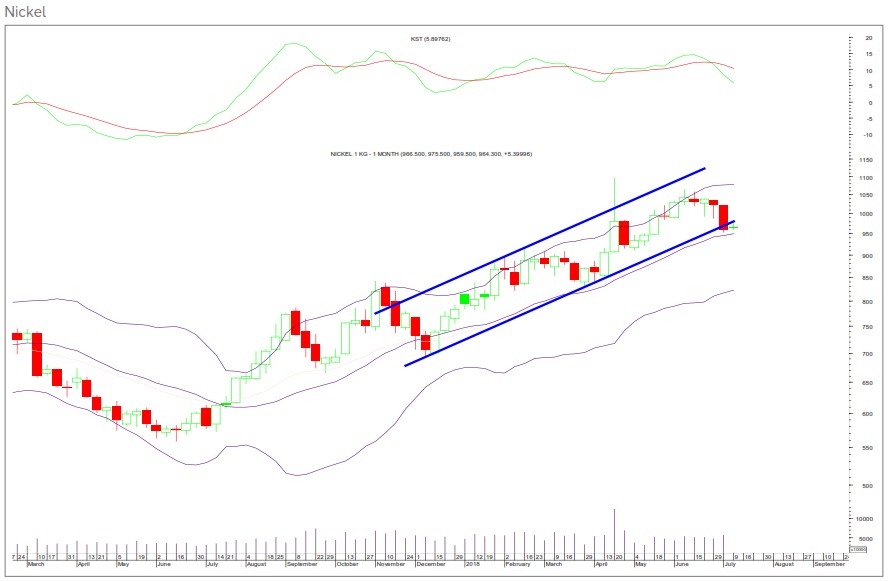
यह पिछले हफ्ते के व्यापार में बढ़ती प्रवृत्ति रेखा समर्थन से टूट गया है और इसके नीचे ही बना रहा है। यदि यह प्रवृत्ति रेखा से नीचे रहता है, तो परिणामस्वरूप विक्रय निक निकल को 945-915 समर्थन क्षेत्र में ले जा सकता है। तत्काल प्रतिरोध 975-984 क्षेत्र के पास है। अगर आने वाले कारोबारी सत्रों में यह 984 से नीचे रहता है तो निकल कमजोर दिखेंगे। साप्ताहिक चार्ट भी गतिशील संरचना पर बिक्री का संकेत देने वाले गति संकेतक पर नकारात्मक क्रॉसओवर लगाता है।


Intraday Range & Trend