


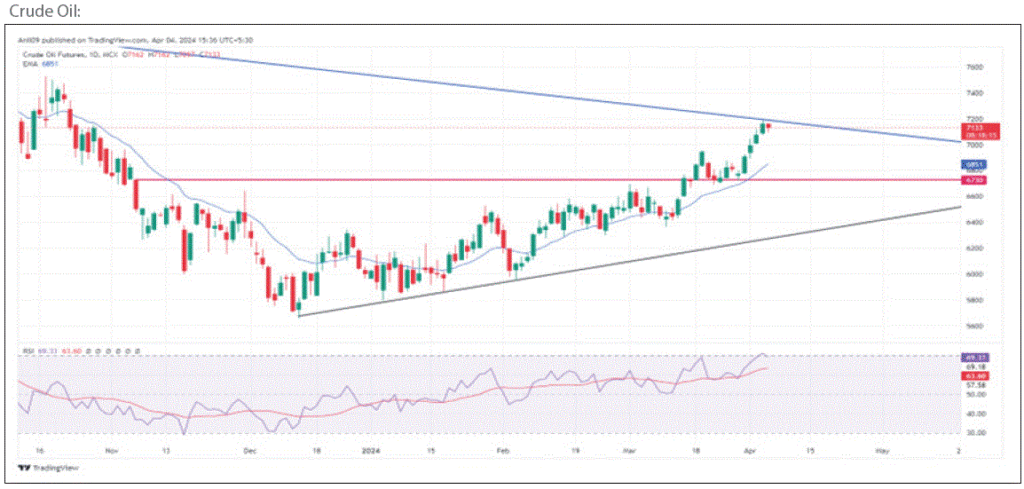
crude oil paints a bullish picture

Crude Oil Poised for Further Gains?
The daily chart for crude oil paints a bullish picture. After surpassing the previous swing high of ₹6,950, prices are now testing a crucial resistance zone. This zone is defined by the 61.8% and 76.8% Fibonacci retracement levels, which fall around ₹7,050 and ₹7,150 respectively.
Technical Indicators Signal Bullish Move
Supporting the bullish sentiment is the RSI indicator, which has recently experienced a positive crossover. This suggests that upward momentum is strong, and the RSI is approaching the overbought territory.
Trading Strategy: Buy on Dips with Caution
As long as prices hold above yesterday’s low, a “buy on dips” strategy could be considered. This means taking advantage of temporary price drops to enter long positions. However, a cautious approach is advised. If prices fall below the critical support level of ₹6,980, it could signal a potential reversal and a bearish trend.
Target and Stop-Loss Levels
For those employing the “buy on dips” strategy, potential target levels for the upcoming session could be around ₹7,150 or even ₹7,200. Conversely, a stop-loss order should be placed below ₹6,980 to mitigate potential losses if the price takes a bearish turn.
Overall Bias: Positive with Caution
Based on the current technical indicators, the overall bias for crude oil leans towards the positive side for the day ahead. However, traders should be mindful of the resistance levels and the possibility of a pullback if prices fail to break through.
 Hindi
Hindi
क्या कच्चा तेल आगे बढ़त के लिए तैयार है?
कच्चे तेल का दैनिक चार्ट तेजी का चित्र प्रस्तुत करता है। पिछले स्विंग हाई ₹6,950 को पार करने के बाद, कीमतें अब एक महत्वपूर्ण प्रतिरोध क्षेत्र का परीक्षण कर रही हैं। यह क्षेत्र 61.8% और 76.8% फाइबोनैचि रिट्रेसमेंट स्तरों द्वारा परिभाषित किया गया है, जो क्रमशः ₹7,050 और ₹7,150 के आसपास आते हैं।
तकनीकी संकेतक तेजी की चाल का संकेत देते हैं
तेजी की धारणा का समर्थन करने वाला RSI संकेतक है, जिसने हाल ही में एक सकारात्मक क्रॉसओवर का अनुभव किया है। इससे पता चलता है कि ऊपर की ओर गति मजबूत है, और RSI ओवरबॉट क्षेत्र के करीब पहुंच रहा है।
ट्रेडिंग रणनीति: सावधानी के साथ गिरावट पर खरीदें
जब तक कीमतें कल के निचले स्तर से ऊपर रहती हैं, तब तक “गिरावट पर खरीदें” रणनीति पर विचार किया जा सकता है। इसका मतलब है कि लंबी स्थिति में प्रवेश करने के लिए अस्थायी मूल्य गिरावट का लाभ उठाना। हालांकि, सतर्क रहने की सलाह दी जाती है। यदि मूल्य ₹6,980 के महत्वपूर्ण समर्थन स्तर से नीचे गिरते हैं, तो यह संभावित उलटफेर और मंदी के रुझान का संकेत दे सकता है।
लक्ष्य और स्टॉप-लॉस स्तर
“गिरावट पर खरीदें” रणनीति अपनाने वालों के लिए, आगामी सत्र के लिए संभावित लक्ष्य स्तर ₹7,150 या ₹7,200 के आसपास हो सकते हैं। इसके विपरीत, यदि
Disclaimer: This analysis is for informational purposes only and should not be considered financial advice. Conduct your own research and due diligence before making any trading decisions.
If you liked this article, then please share it on the social networking site. You can also find us on Twitter, Facebook, YouTube, and Instagram, Telegram.


Intraday Range & Trend


