Friday, May 9, 2025
  • International Commodity
  • MCX Trend
  • Market Holiday
  • Pricing
  • Login / Register
Shubhlaxmi Commodity
Contactus
  • Home
  • Pricing
    • Register
    • Login
    • Subscription Plan
    • My wishlists
    • Bank Details
  • Member Zone
    • Intraday View
    • Positional View
    • International View
    • NSE
      • NSE FO & Stock Power Levels OLD
    • MCX
  • Pivot Zone
    • NSE Pivot Point
      • NSE Top 10 Gainers & Losers Pivot Points
      • Top 20 Future Stock Pivot Point
      • Nifty Option (CE, PE) Support Resistance
      • Bank Nifty Option (CE, PE) Support Resistance
      • Index Future Daily Pivot Point
      • Nifty 50 Stock Daily Pivot Point
      • Nifty 50 Stock Weekly Pivot Point
      • NSE Future Stock Daily Pivot Point
      • NSE Future Stock Weekly Pivot Point
    • MCX Pivot Point
      • MCX Daily Pivot Points
      • MCX Weekly Pivot Point
    • Ncdex Pivot Point
      • NCDEX Daily Pivot Point
      • NCDEX Weekly Pivot Point
    • Comex & LME Pivot Point
      • Comex & LME Daily Pivot Point
      • Comex & LME Weekly Pivot Point
    • INR Currency & Forex Pivot
      • Indian Currency Pairs Pivot Point
      • Forex Currency Pairs Pivot Point
      • NSE USD-INR Pivot Level Live Chart
    • How to Use Pivot Point Level
  • Free Zone
    • Market Tools
      • Camarilla Calculator
      • Gann Square of 9 Calculator
      • Commodity International Prices
      • Commodity Inventory Data
      • Market Holiday
      • SPAN Margin MCX Commodity
    • Market Trend
      • MCX Trend
      • Ncdex Market Trend
    • Price Volume Open Interest
      • Nifty Option (CE, PE) Price Volume Open Interest
      • Bank Nifty Option (CE, PE) Price Volume Open Interest
      • MCX Price Volume and Open Interest
      • Index Futures Price Volume OI
      • Stock Futures Price Volume Open Interest
      • Ncdex Price Volume Open Interest
    • Technical Analysis
      • Technical Analysis
  • Contact
    • Contact us
    • Cookie Policy
    • Terms & Conditions
    • Refund & Cancellation Policy
    • Privacy Policy
    • Disclaimer

No products in the cart.

No Result
View All Result
Shubhlaxmi Commodity
  • Home
  • Pricing
    • Register
    • Login
    • Subscription Plan
    • My wishlists
    • Bank Details
  • Member Zone
    • Intraday View
    • Positional View
    • International View
    • NSE
      • NSE FO & Stock Power Levels OLD
    • MCX
  • Pivot Zone
    • NSE Pivot Point
      • NSE Top 10 Gainers & Losers Pivot Points
      • Top 20 Future Stock Pivot Point
      • Nifty Option (CE, PE) Support Resistance
      • Bank Nifty Option (CE, PE) Support Resistance
      • Index Future Daily Pivot Point
      • Nifty 50 Stock Daily Pivot Point
      • Nifty 50 Stock Weekly Pivot Point
      • NSE Future Stock Daily Pivot Point
      • NSE Future Stock Weekly Pivot Point
    • MCX Pivot Point
      • MCX Daily Pivot Points
      • MCX Weekly Pivot Point
    • Ncdex Pivot Point
      • NCDEX Daily Pivot Point
      • NCDEX Weekly Pivot Point
    • Comex & LME Pivot Point
      • Comex & LME Daily Pivot Point
      • Comex & LME Weekly Pivot Point
    • INR Currency & Forex Pivot
      • Indian Currency Pairs Pivot Point
      • Forex Currency Pairs Pivot Point
      • NSE USD-INR Pivot Level Live Chart
    • How to Use Pivot Point Level
  • Free Zone
    • Market Tools
      • Camarilla Calculator
      • Gann Square of 9 Calculator
      • Commodity International Prices
      • Commodity Inventory Data
      • Market Holiday
      • SPAN Margin MCX Commodity
    • Market Trend
      • MCX Trend
      • Ncdex Market Trend
    • Price Volume Open Interest
      • Nifty Option (CE, PE) Price Volume Open Interest
      • Bank Nifty Option (CE, PE) Price Volume Open Interest
      • MCX Price Volume and Open Interest
      • Index Futures Price Volume OI
      • Stock Futures Price Volume Open Interest
      • Ncdex Price Volume Open Interest
    • Technical Analysis
      • Technical Analysis
  • Contact
    • Contact us
    • Cookie Policy
    • Terms & Conditions
    • Refund & Cancellation Policy
    • Privacy Policy
    • Disclaimer
No Result
View All Result
Shubhlaxmi Commodity

Bollinger Bands A Technical Analysis Tool

Bollinger Bands are a technical analysis tool developed by John Bollinger in the early 1980s. They are a type of price envelope that is plotted two standard deviations above and below a simple moving average of the price. The bands are typically 20 days in length, but this can be customized.

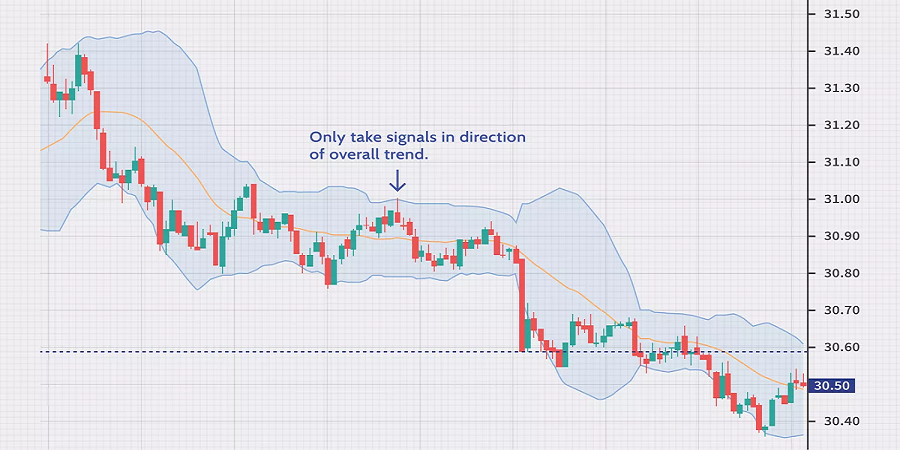
Bollinger Bands are used to identify overbought and oversold conditions, as well as to track the volatility of a market. When prices move closer to the upper band, it indicates that the market may be overbought. Conversely, the market may be oversold when prices end up moving closer to the lower or bottom band.

Bollinger Bands can also be used to identify trends. When the bands are relatively narrow, it indicates that the market is in a trend. When the bands are wide, it indicates that the market is in a period of high volatility.

Bollinger Bands are a versatile technical analysis tool that can be used to identify a variety of market conditions. They are a popular tool among traders and investors, and they can be used to supplement other technical analysis techniques.

Bollinger Bands technical analysis

Here are some of the key concepts of Bollinger Bands:

  • Bollinger Bands are a type of price envelope. This means that they are a graphical representation of the range of prices that a security has traded within over a given period of time.
  • The bands are typically two standard deviations above and below a simple moving average of the price. This means that they are calculated by taking the standard deviation of the price over a given period of time and then adding or subtracting two standard deviations from the moving average.
  • The width of the bands can be used to measure volatility. When the bands are narrow, it indicates that the market is in a period of low volatility. When the bands are wide, it indicates that the market is in a period of high volatility.
  • Bollinger Bands can be used to identify overbought and oversold conditions. When prices move closer to the upper band, it indicates that the market may be overbought. Conversely, the market may be oversold when prices end up moving closer to the lower or bottom band.
  • Bollinger Bands can also be used to identify trends. When the bands are relatively narrow, it indicates that the market is in a trend. When the bands are wide, it indicates that the market is in a period of high volatility.

Bollinger Bands are a powerful technical analysis tool that can be used to identify a variety of market conditions. They are a popular tool among traders and investors, and they can be used to supplement other technical analysis techniques.

Here are some tips for using Bollinger Bands:

  • Use Bollinger Bands in conjunction with other technical analysis techniques. Bollinger Bands are not a standalone indicator, and they should be used in conjunction with other techniques to get a more complete picture of the market.
  • Customize the settings of Bollinger Bands to fit your trading style. The default settings for Bollinger Bands are 20 days and 2 standard deviations. However, you may want to adjust these settings to fit your own trading style.
  • Be aware of the limitations of Bollinger Bands. Bollinger Bands are not perfect, and they can generate false signals. It is important to be aware of the limitations of Bollinger Bands before using them to make trading decisions.

Bollinger Bands are a valuable tool for technical analysis, but they should not be used as the sole basis for making trading decisions. They should be used in conjunction with other technical analysis techniques and with a healthy dose of common sense.

If you liked this article, then please share it on the social networking site. You can also find us on Twitter, Facebook, YouTube, and Instagram, Telegram.

Tags: Technical Analysis
Previous Post

Gold mini Sideways Bearish

Next Post

MCX Natural Gas Bearish Short-Term Outlook

Related Posts

Index Futures Price Volume Open Interest
Market Tools

Index Futures Price Volume Open Interest

March 3, 2025
0
Nse Futures Price Volume Open Interest
Knowledge Center

Nse Futures Price Volume Open Interest

March 4, 2025
0
Unveiling Market Secrets Price, Volume, and Open Interest
Knowledge Center

Unveiling Market Secrets: Price, Volume, and Open Interest

January 18, 2025
0
Bollinger Bands A Technical Analysis Tool
Knowledge Center

Bollinger Bands A Technical Analysis Tool

August 7, 2023
0
Marubozu-Candle-Stick
Knowledge Center

Marubozu Japanese candlestick pattern

August 7, 2023
0
Price Volume and Open Interest
Knowledge Center

Ncdex Price Volume Open Interest

March 3, 2025
0
Next Post
MCX Natural Gas Bearish Short-Term Outlook

MCX Natural Gas Bearish Short-Term Outlook

Intraday Range & Trend

Position Size Calculator
  • Login
  • Register
Call us: +919221548869

© 2008-2025 SHUBHLAXMI COMMODITY

Login
Use Phone Number
Use Email Address
Not a member yet? Register Now
Reset Password
Use Phone Number
Use Email Address
Register
Already a member? Login Now
Shubhlaxmi
  • Home
  • Pricing
    • Register
    • Login
    • Subscription Plan
    • My wishlists
    • Bank Details
  • Member Zone
    • Intraday View
    • Positional View
    • International View
    • NSE
      • NSE FO & Stock Power Levels OLD
    • MCX
  • Pivot Zone
    • NSE Pivot Point
      • NSE Top 10 Gainers & Losers Pivot Points
      • Top 20 Future Stock Pivot Point
      • Nifty Option (CE, PE) Support Resistance
      • Bank Nifty Option (CE, PE) Support Resistance
      • Index Future Daily Pivot Point
      • Nifty 50 Stock Daily Pivot Point
      • Nifty 50 Stock Weekly Pivot Point
      • NSE Future Stock Daily Pivot Point
      • NSE Future Stock Weekly Pivot Point
    • MCX Pivot Point
      • MCX Daily Pivot Points
      • MCX Weekly Pivot Point
    • Ncdex Pivot Point
      • NCDEX Daily Pivot Point
      • NCDEX Weekly Pivot Point
    • Comex & LME Pivot Point
      • Comex & LME Daily Pivot Point
      • Comex & LME Weekly Pivot Point
    • INR Currency & Forex Pivot
      • Indian Currency Pairs Pivot Point
      • Forex Currency Pairs Pivot Point
      • NSE USD-INR Pivot Level Live Chart
    • How to Use Pivot Point Level
  • Free Zone
    • Market Tools
      • Camarilla Calculator
      • Gann Square of 9 Calculator
      • Commodity International Prices
      • Commodity Inventory Data
      • Market Holiday
      • SPAN Margin MCX Commodity
    • Market Trend
      • MCX Trend
      • Ncdex Market Trend
    • Price Volume Open Interest
      • Nifty Option (CE, PE) Price Volume Open Interest
      • Bank Nifty Option (CE, PE) Price Volume Open Interest
      • MCX Price Volume and Open Interest
      • Index Futures Price Volume OI
      • Stock Futures Price Volume Open Interest
      • Ncdex Price Volume Open Interest
    • Technical Analysis
      • Technical Analysis
  • Contact
    • Contact us
    • Cookie Policy
    • Terms & Conditions
    • Refund & Cancellation Policy
    • Privacy Policy
    • Disclaimer

© 2008-2025 SHUBHLAXMI COMMODITY

This website uses cookies. By continuing to use this website, you are giving consent to cookies being used. Visit our Privacy and Cookie Policy.