Gold mini Sideways Bearish
Gold mini
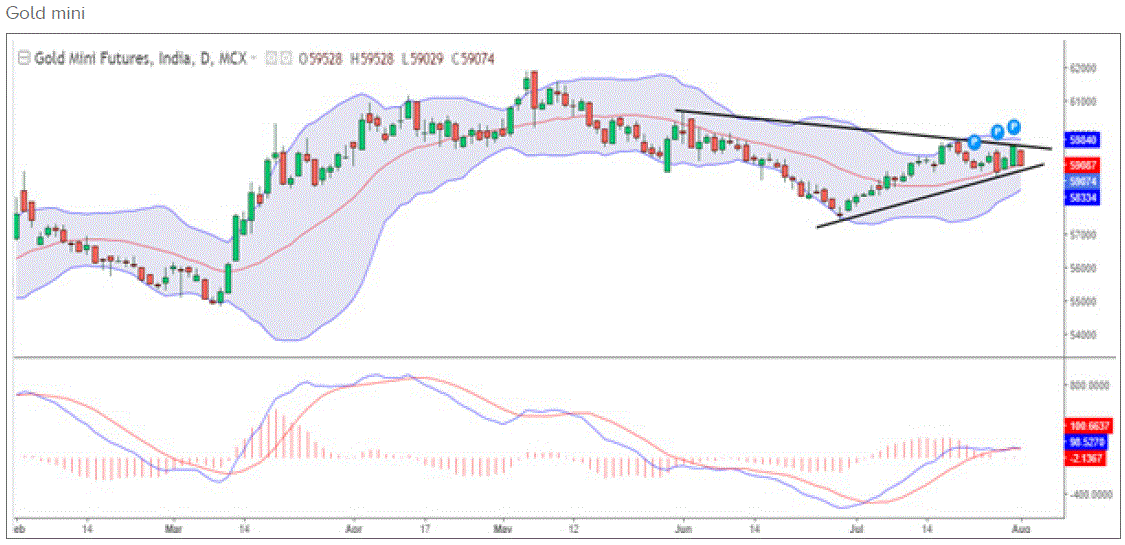
The MCX Gold Mini price has been trading in a sideways range for the past few days, unable to break through the upper trend line resistance at 59,850. Yesterday’s negative close, however, indicates that the short-term trend is bearish.
The price has now formed a “Marubozu” bearish candlestick pattern, which is a strong signal of a downtrend. The price is currently hovering near the lower trend line and middle Bollinger support at 59,100. If the price breaks below this level, it could fall to 58,400 in the near term.
The key resistance level is 59,850. If the price breaks above this level, it could signal a trend reversal. However, the price indicator has given a negative crossover, which suggests that a strong downtrend is likely in the upcoming sessions.

Here is a more detailed analysis of the technical indicators:
- The moving average convergence divergence (MACD) indicator has crossed below the signal line, which is a bearish signal.
- The relative strength index (RSI) is below 50, which is also a bearish signal.
- The stochastic oscillator is in oversold territory, which could mean that the price is due for a bounce.
However, the overall trend is bearish, and the price is likely to continue to fall in the near term. Traders should be cautious and avoid buying the dip until there is a clear sign of a trend reversal.
Here are some of the factors that could cause the price of gold to fall further:
- Rising interest rates in the United States, which could make gold less attractive as an investment.
- A stronger US dollar, which could make gold more expensive for buyers in other currencies.
- Weak economic growth could reduce demand for gold as a safe haven asset.
Traders should monitor these factors closely and adjust their trading strategies accordingly.
If you liked this article, then please share it on the social networking site. You can also find us on Twitter, Facebook, YouTube, and Instagram, Telegram.


