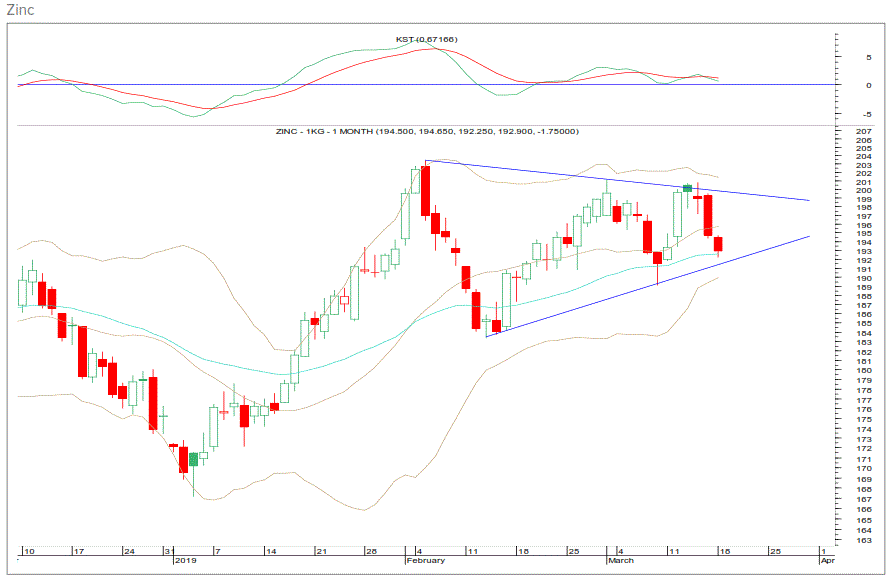
Zinc consolidating triangle pattern
Adjacent chart shows price movement of MCX Zinc continuous contract. Zinc consolidating triangle pattern. On the way down, 189 – 192 is a crucial support zone whereas on the way up, 200.50 – 203 will act as resistance in the near term. It is likely to consolidate within 192 – 200.50 in the near term. However, zinc can drift lower towards 185 – 183 levels once it breaks the support zone of 192 – 189. Overall, the trend in zinc shall remain bearish as long as it does not close above 204. The daily momentum indicator has turned bearish.

MCX Zinc Pivot Level Live Chart
If you liked this article, then please share to the social networking site. You can also find us on Twitter, Facebook, YouTube, Google+ and Instagram, Telegram.
Zinc consolidating triangle pattern


