Ncdex Turmeric Triangle breakdown
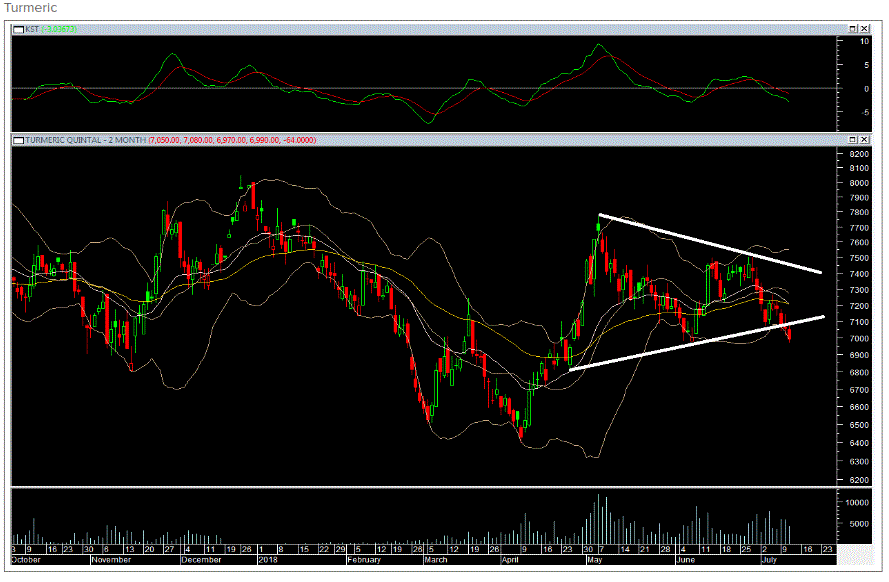
From the below chart of Ncdex Turmeric (Continuous contract), the prices have broken down from a symmetrical triangle formation on daily charts. Immediate support is at the swing low of 6980. If Ncdex Turmeric sustains below the given support, the triangle breakdown can act as a bear catalyst in coming sessions and lead to further decline. On the upside, resistance is capped at 7115 levels. The momentum indicator has given a sell signal with a negative crossover on daily and weekly charts, hence it is advisable to use sell on rising strategy.

एनसीडीएक्स हल्दी चार्ट से, कीमतें दैनिक चार्ट पर एक सममित त्रिभुज गठन से टूट गई हैं। तत्काल समर्थन 6980 के स्विंग लोअर पर है। यदि हल्दी दिए गए समर्थन से नीचे रहता है, तो त्रिभुज टूटने आने वाले सत्रों में भालू उत्प्रेरक के रूप में कार्य कर सकता है और आगे गिरावट का कारण बन सकता है। ऊपर की तरफ, प्रतिरोध 7115 स्तर पर रखा गया है। गति सूचक ने दैनिक और साप्ताहिक चार्ट पर नकारात्मक क्रॉसओवर के साथ एक विक्रय संकेत दिया है, इसलिए सलाह दी जाती है कि बढ़ती रणनीति पर बिक्री का उपयोग करें।


