Friday, May 9, 2025
  • International Commodity
  • MCX Trend
  • Market Holiday
  • Pricing
  • Login / Register
Shubhlaxmi Commodity
Contactus
  • Home
  • Pricing
    • Register
    • Login
    • Subscription Plan
    • My wishlists
    • Bank Details
  • Member Zone
    • Intraday View
    • Positional View
    • International View
    • NSE
      • NSE FO & Stock Power Levels OLD
    • MCX
  • Pivot Zone
    • NSE Pivot Point
      • NSE Top 10 Gainers & Losers Pivot Points
      • Top 20 Future Stock Pivot Point
      • Nifty Option (CE, PE) Support Resistance
      • Bank Nifty Option (CE, PE) Support Resistance
      • Index Future Daily Pivot Point
      • Nifty 50 Stock Daily Pivot Point
      • Nifty 50 Stock Weekly Pivot Point
      • NSE Future Stock Daily Pivot Point
      • NSE Future Stock Weekly Pivot Point
    • MCX Pivot Point
      • MCX Daily Pivot Points
      • MCX Weekly Pivot Point
    • Ncdex Pivot Point
      • NCDEX Daily Pivot Point
      • NCDEX Weekly Pivot Point
    • Comex & LME Pivot Point
      • Comex & LME Daily Pivot Point
      • Comex & LME Weekly Pivot Point
    • INR Currency & Forex Pivot
      • Indian Currency Pairs Pivot Point
      • Forex Currency Pairs Pivot Point
      • NSE USD-INR Pivot Level Live Chart
    • How to Use Pivot Point Level
  • Free Zone
    • Market Tools
      • Camarilla Calculator
      • Gann Square of 9 Calculator
      • Commodity International Prices
      • Commodity Inventory Data
      • Market Holiday
      • SPAN Margin MCX Commodity
    • Market Trend
      • MCX Trend
      • Ncdex Market Trend
    • Price Volume Open Interest
      • Nifty Option (CE, PE) Price Volume Open Interest
      • Bank Nifty Option (CE, PE) Price Volume Open Interest
      • MCX Price Volume and Open Interest
      • Index Futures Price Volume OI
      • Stock Futures Price Volume Open Interest
      • Ncdex Price Volume Open Interest
    • Technical Analysis
      • Technical Analysis
  • Contact
    • Contact us
    • Cookie Policy
    • Terms & Conditions
    • Refund & Cancellation Policy
    • Privacy Policy
    • Disclaimer

No products in the cart.

No Result
View All Result
Shubhlaxmi Commodity
  • Home
  • Pricing
    • Register
    • Login
    • Subscription Plan
    • My wishlists
    • Bank Details
  • Member Zone
    • Intraday View
    • Positional View
    • International View
    • NSE
      • NSE FO & Stock Power Levels OLD
    • MCX
  • Pivot Zone
    • NSE Pivot Point
      • NSE Top 10 Gainers & Losers Pivot Points
      • Top 20 Future Stock Pivot Point
      • Nifty Option (CE, PE) Support Resistance
      • Bank Nifty Option (CE, PE) Support Resistance
      • Index Future Daily Pivot Point
      • Nifty 50 Stock Daily Pivot Point
      • Nifty 50 Stock Weekly Pivot Point
      • NSE Future Stock Daily Pivot Point
      • NSE Future Stock Weekly Pivot Point
    • MCX Pivot Point
      • MCX Daily Pivot Points
      • MCX Weekly Pivot Point
    • Ncdex Pivot Point
      • NCDEX Daily Pivot Point
      • NCDEX Weekly Pivot Point
    • Comex & LME Pivot Point
      • Comex & LME Daily Pivot Point
      • Comex & LME Weekly Pivot Point
    • INR Currency & Forex Pivot
      • Indian Currency Pairs Pivot Point
      • Forex Currency Pairs Pivot Point
      • NSE USD-INR Pivot Level Live Chart
    • How to Use Pivot Point Level
  • Free Zone
    • Market Tools
      • Camarilla Calculator
      • Gann Square of 9 Calculator
      • Commodity International Prices
      • Commodity Inventory Data
      • Market Holiday
      • SPAN Margin MCX Commodity
    • Market Trend
      • MCX Trend
      • Ncdex Market Trend
    • Price Volume Open Interest
      • Nifty Option (CE, PE) Price Volume Open Interest
      • Bank Nifty Option (CE, PE) Price Volume Open Interest
      • MCX Price Volume and Open Interest
      • Index Futures Price Volume OI
      • Stock Futures Price Volume Open Interest
      • Ncdex Price Volume Open Interest
    • Technical Analysis
      • Technical Analysis
  • Contact
    • Contact us
    • Cookie Policy
    • Terms & Conditions
    • Refund & Cancellation Policy
    • Privacy Policy
    • Disclaimer
No Result
View All Result
Shubhlaxmi Commodity

MCX Zinc Bearish Trend

MCX Zinc Slumps Is the Bearish Trend


MCX Zinc Bearish Trend

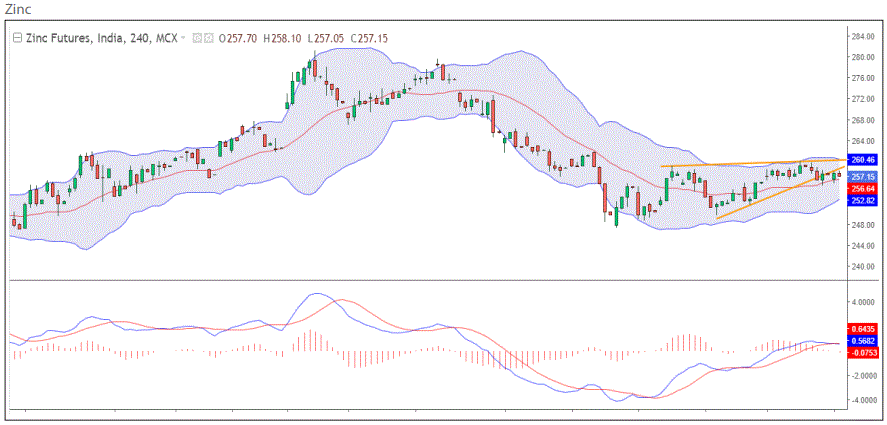
The daily chart for MCX Zinc paints a concerning picture for bulls. A recent trend line breakdown coupled with a break below the 230 support level signals a short-term bearish trend. This breakdown suggests the price momentum has shifted downwards, potentially leading to further declines.

Technical Analysis Supports Bearish Outlook:

  • Gap Down Open: The price opened with a gap down, indicating a significant drop from the previous day’s close and fueling further downside pressure.
  • Key Resistance: The 235 level represents a crucial resistance zone. A break above this level might signal a trend reversal, suggesting a potential return to bullish sentiment.

Trading Strategy:

Given the current technical analysis, minor price increases below the 235 resistance could be viewed as selling opportunities. This short-selling strategy aims to profit from a potential continuation of the downtrend. However, it’s important to exercise caution, as the market can be unpredictable.

Understanding the Bearish Landscape:

  • Price Indicator: While the text mentions a “bearish price indicator,” specifying the exact indicator (e.g., RSI, MACD) would provide more granular details about the bearish sentiment.
  • Additional Indicators: Consider incorporating other technical indicators like Stochastic Oscillator or Average Directional Index (ADX) to gain a more comprehensive picture of price momentum and potential trend reversals. These indicators can help identify overbought or oversold conditions that might signal potential turning points.

Making Informed Decisions:

  • Market Volatility: The metals market is susceptible to various factors like supply chain disruptions, global economic health, and industrial demand fluctuations. These factors can significantly impact Zinc prices.
  • Global Inventory Levels: Monitor global Zinc inventory levels. Rising stockpiles can exert downward pressure on prices while dwindling supplies could lead to a price increase.
  • Confirmation of Trend Reversal: A sustained move above the 235 resistance would signal a potential trend reversal, suggesting a bullish bias.

MCX Zinc Bearish Trend

Disclaimer: This analysis is for informational purposes only and should not be considered financial advice. Conduct your own research and due diligence before making any trading decisions.

If you liked this article, please share it on social networking. You can also find us on Twitter, Facebook, YouTube, and Instagram, Telegram.

Tags: base metalsMCXMetalSupport & ResistanceTechnical Comment & Chartszinc
Previous Post

Natural Gas Bearish Trendline Breakdown

Next Post

Copper Double Bottom Bullish Breakout

Related Posts

Expert Daily Commodity Market Technical Analysis & Trade Ideas
Technical Charts

Expert Daily Commodity Market Technical Analysis & Trade Ideas April 11, 2025

April 11, 2025
0
Bank Nifty Option (CE, PE) Price Volume Open Interest
NSE

Bank Nifty Option (CE, PE) Price Volume Open Interest

March 4, 2025
0
Nifty Option (CE, PE) Price Volume Open Interest
NSE

Nifty Option (CE, PE) Price Volume Open Interest

March 4, 2025
0
Copper Base Metals
Base Metal

Copper broke a crucial support

November 14, 2024
0
trading below
Bullion

MCX Gold Mini Bearish Pressure Mounts

November 12, 2024
0
Copper Selling
Base Metal

Copper Double Bottom Bullish Breakout

June 26, 2024
0
Next Post
Copper Selling

Copper Double Bottom Bullish Breakout

Intraday Range & Trend

Silver Strength Meter QR
  • Login
  • Register
Call us: +919221548869

© 2008-2025 SHUBHLAXMI COMMODITY

Login
Use Phone Number
Use Email Address
Not a member yet? Register Now
Reset Password
Use Phone Number
Use Email Address
Register
Already a member? Login Now
Shubhlaxmi
  • Home
  • Pricing
    • Register
    • Login
    • Subscription Plan
    • My wishlists
    • Bank Details
  • Member Zone
    • Intraday View
    • Positional View
    • International View
    • NSE
      • NSE FO & Stock Power Levels OLD
    • MCX
  • Pivot Zone
    • NSE Pivot Point
      • NSE Top 10 Gainers & Losers Pivot Points
      • Top 20 Future Stock Pivot Point
      • Nifty Option (CE, PE) Support Resistance
      • Bank Nifty Option (CE, PE) Support Resistance
      • Index Future Daily Pivot Point
      • Nifty 50 Stock Daily Pivot Point
      • Nifty 50 Stock Weekly Pivot Point
      • NSE Future Stock Daily Pivot Point
      • NSE Future Stock Weekly Pivot Point
    • MCX Pivot Point
      • MCX Daily Pivot Points
      • MCX Weekly Pivot Point
    • Ncdex Pivot Point
      • NCDEX Daily Pivot Point
      • NCDEX Weekly Pivot Point
    • Comex & LME Pivot Point
      • Comex & LME Daily Pivot Point
      • Comex & LME Weekly Pivot Point
    • INR Currency & Forex Pivot
      • Indian Currency Pairs Pivot Point
      • Forex Currency Pairs Pivot Point
      • NSE USD-INR Pivot Level Live Chart
    • How to Use Pivot Point Level
  • Free Zone
    • Market Tools
      • Camarilla Calculator
      • Gann Square of 9 Calculator
      • Commodity International Prices
      • Commodity Inventory Data
      • Market Holiday
      • SPAN Margin MCX Commodity
    • Market Trend
      • MCX Trend
      • Ncdex Market Trend
    • Price Volume Open Interest
      • Nifty Option (CE, PE) Price Volume Open Interest
      • Bank Nifty Option (CE, PE) Price Volume Open Interest
      • MCX Price Volume and Open Interest
      • Index Futures Price Volume OI
      • Stock Futures Price Volume Open Interest
      • Ncdex Price Volume Open Interest
    • Technical Analysis
      • Technical Analysis
  • Contact
    • Contact us
    • Cookie Policy
    • Terms & Conditions
    • Refund & Cancellation Policy
    • Privacy Policy
    • Disclaimer

© 2008-2025 SHUBHLAXMI COMMODITY

This website uses cookies. By continuing to use this website, you are giving consent to cookies being used. Visit our Privacy and Cookie Policy.