MCX Natural gas is trading within two major trend lines
एमसीएक्स नेचुरल गैस दो प्रमुख ट्रेंड लाइन के भीतर कारोबार कर रही है
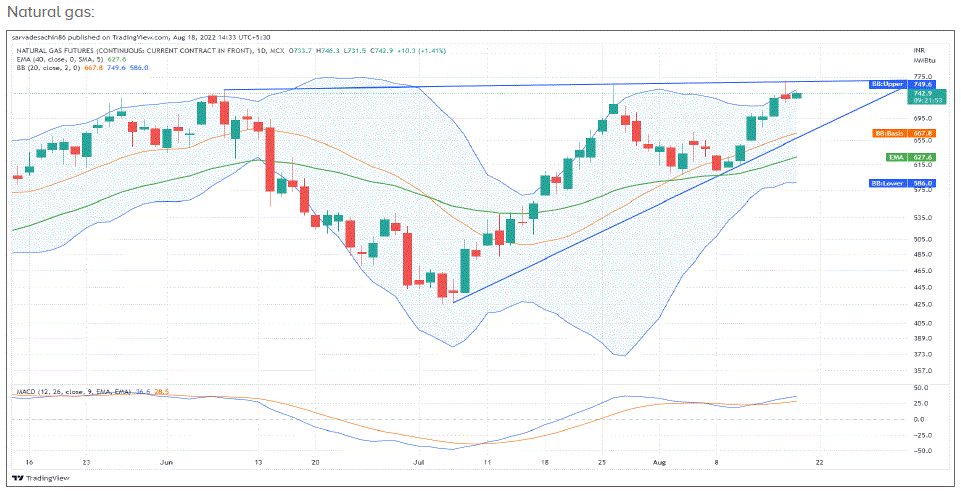
एमसीएक्स नेचुरल गैस दो प्रमुख ट्रेंड लाइनों के भीतर कारोबार कर रही है, ऐसा लगता है कि दैनिक चार्ट पर बनाने में एक त्रिकोण पैटर्न है, दोनों तरफ ब्रेकआउट / ब्रेकडाउन प्रवृत्ति को स्पष्ट दिशा देगा, और तब तक यह इन दो प्रवृत्ति लाइनों के भीतर व्यापार करेगा। कल का उच्च 766.90 एक उल्टा ब्रेकआउट के लिए महत्वपूर्ण है, और 665 से नीचे यह एक नकारात्मक चाल देगा। प्राकृतिक गैस 20DMA और 40DEMA से ऊपर कारोबार कर रही है, और गति संकेतक सकारात्मक क्षेत्र में कारोबार कर रहा है, जो बताता है कि एक उल्टा ब्रेकआउट संभव हो सकता है, लेकिन किसी को ब्रेकआउट की प्रतीक्षा करनी चाहिए। प्रतिरोध 767- 770 के स्तर पर है और समर्थन 668-665 के स्तर पर रखा गया है।

MCX Natural gas is trading within two major trend lines
MCX Natural gas is trading within two major trend lines seems to be a triangle pattern in making on daily charts either side breakout/breakdown will give clear direction to the trend, and till then it will trade within these two trend lines. Yesterday’s high of 766.90 is important for an upside breakout, and below 665 it will give a downside move. Natural gas is trading above 20DMA & 40DEMA, and the momentum indicator is trading in the positive zone, which suggests an upside breakout may be possible, but one should wait for a breakout. Resistance is 767- 770 levels and support is placed at 668-665 levels.
If you liked this article, please share it on the social networking site. You can also find us on Twitter, Facebook, Instagram, and, Telegram.


