

MCX Natural gas has broken the medium trend line
Adjacent chart shows the price movement of MCX Natural gas continuous contract. MCX Natural gas managed to break 61.8% retracement level of its previous fall but couldn’t sustain above it. In Friday’s trading session, mcx natural gas has broken the medium trend line. In the near term, 194.70 will be a crucial support on the way down. If it breaks below 194.70 then it can drift lower towards 191 – 187 in the short term. On the way up, 200 – 203.50 will act as resistance. Since natural gas has broken the trend line support, the short-term trend has turned bearish. Bounce towards the resistance level shall be considered as selling opportunity as long as it is trading below 209. The daily momentum indicator is bearish.
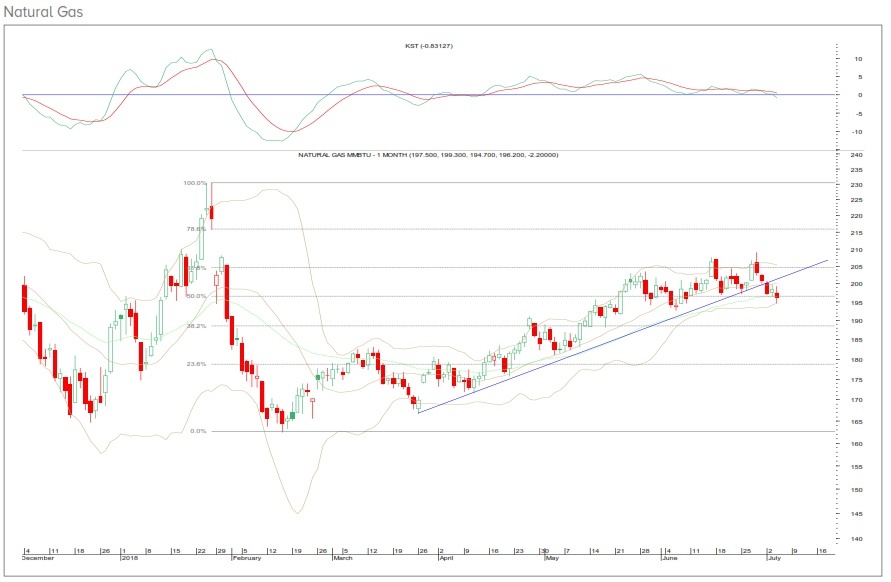
निकट चार्ट MCX Natural gas निरंतर अनुबंध की price movement दिखाता है। MCX Natural gas पिछले गिरावट के 61.8% रिट्रेसमेंट स्तर को तोड़ने में कामयाब रही लेकिन इससे ऊपर नहीं रह सका। शुक्रवार के कारोबारी सत्र में, प्राकृतिक गैस ने मध्यम प्रवृत्ति रेखा को तोड़ दिया है। निकट अवधि में, 194.70 नीचे रास्ते पर एक महत्वपूर्ण समर्थन होगा। यदि यह 194.70 से नीचे टूट जाता है तो यह अल्प अवधि में 191 – 187 की ओर कम हो सकता है। रास्ते में, 200 – 203.50 प्रतिरोध के रूप में कार्य करेगा। चूंकि MCX Natural gas ने ट्रेंड लाइन समर्थन को तोड़ दिया है, इसलिए अल्पकालिक प्रवृत्ति मंदी हो गई है। प्रतिरोध स्तर की ओर उछाल को बिक्री के अवसर के रूप में माना जाएगा जब तक कि यह 209 से नीचे कारोबार कर रहा है। दैनिक गति संकेतक मंदी है।


Intraday Range & Trend


