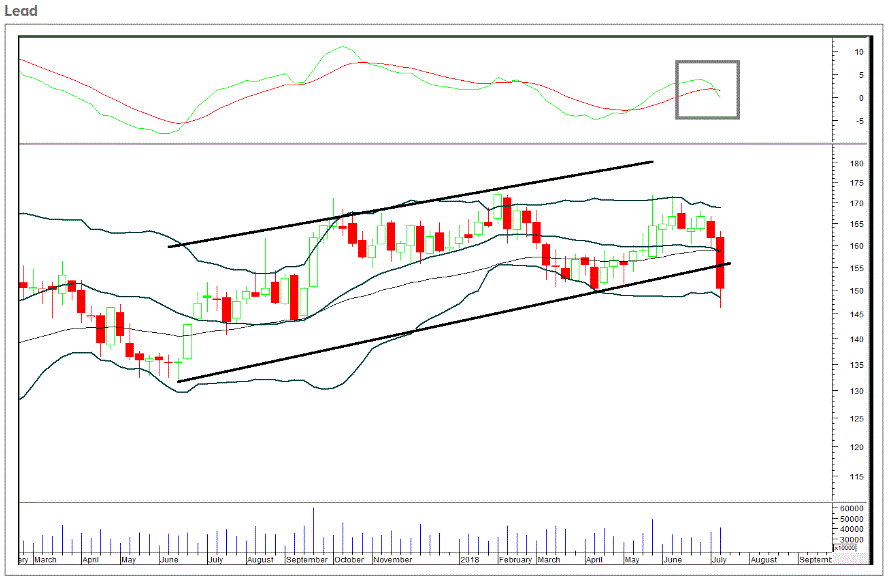
MCX Lead broken weekly rising channel
Below chart shows the price movement of MCX Lead continuous contract. It has broken down from a weekly rising channel trend line support on weekly charts and is sustaining below the same. If it sustains below the trend line on a weekly closing basis, it may lead to further deterioration of chart structure. Immediate resistance is at 155, which is the breakdown area. Any attempt to retest the resistance zone can be used as selling opportunity. Near-term targets on the downside can be 146 and 140. Weekly chart also spots a negative crossover on the momentum indicator indicating sell on rising.

एमसीएक्स लीड साप्ताहिक चार्ट पर बढ़ते चैनल ट्रेंड लाइन समर्थन से टूट गया है और इसके नीचे ही बना रहा है। यदि यह साप्ताहिक समापन आधार पर प्रवृत्ति रेखा से नीचे रहता है, तो इससे चार्ट संरचना में और गिरावट आ सकती है। तत्काल प्रतिरोध 155 पर है, जो टूटने वाला क्षेत्र है। प्रतिरोध क्षेत्र को पुन: स्थापित करने का कोई भी प्रयास अवसर बेचने के रूप में उपयोग किया जा सकता है। डाउनसाइड पर निकट अवधि के लक्ष्य 146 और 140 हो सकते हैं। साप्ताहिक चार्ट गतिशील संकेत पर नकारात्मक क्रॉसओवर भी बढ़ाता है जो बढ़ते हुए बिक्री को दर्शाता है।


