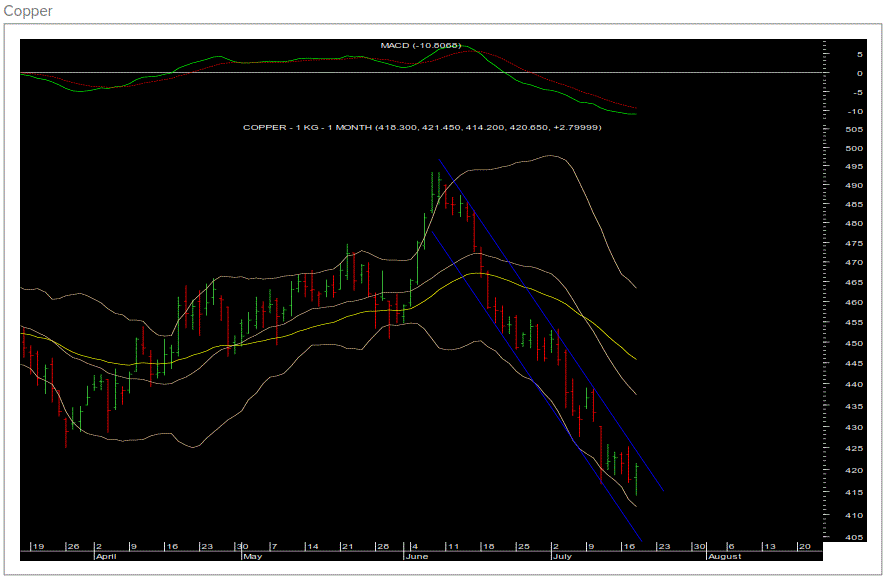
MCX Copper forming lower top lower bottom
The adjacent chart shows the price movement of MCX Copper continuous contract. The commodity has fallen significantly from the high of 493.25 registered in the last month. The entire fall has unfolded in a channelized manner. The fall has been accompanied by the daily momentum indicator. The red metal has been forming a lower top lower bottom formation on the daily chart, which is a bearish sign as per the Dow Theory. Thus unless the hurdle zone of 425-426 gets taken out, Copper is expected to continue with the slide. On the downside, 408 will be the crucial level to watch out for. If the bears manage to break that level on closing basis then the metal can slide down to 384.

MCX Daily Support & Resistance


