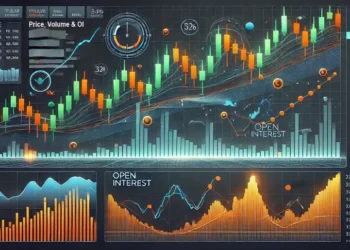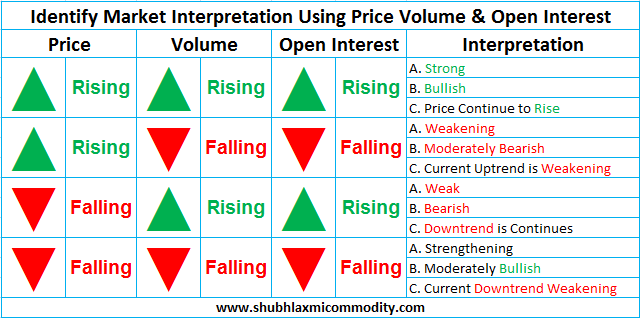


Price Volume and Open Interest
Futures and commodity traders have the benefit of having access to volume and Open Interest data. This isn’t possible in other markets, such as Forex trading. To form a sophisticated trade analysis and make reasonable assumptions about what is happening on your charts, being able to combine the information provided by volume, Open Interest, and price can give traders an extra edge.
वायदा और कमोडिटी व्यापारियों को वॉल्यूम और ओपन Interest डेटा तक पहुंच का लाभ होता है। विदेशी मुद्रा व्यापार जैसे अन्य बाजारों में यह संभव नहीं है। एक परिष्कृत व्यापार विश्लेषण बनाने और अपने चार्ट पर जो हो रहा है, उसके बारे में उचित धारणाएं बनाने के लिए, वॉल्यूम द्वारा प्रदान की गई जानकारी को गठबंधन करने में सक्षम होने के कारण, ओपन Interest और कीमत व्यापारियों को अतिरिक्त बढ़त दे सकती है।
Volume
The volume shows the trading activity in a given market on any given day. Rising volume means that there was more trading activity and more contracts were traded than on the previous day.
During trends, high and rising volume means that trading activity supports the ongoing trend and a trend continuation is likely because more investors (or more contracts traded) support current price movements. Technical analysis also uses volume information to identify potential reversals – if during an uptrend volume declines, and momentum falls, it signals that fewer people are buying into the trend and conviction is declining.
वॉल्यूम किसी दिए गए दिन किसी दिए गए बाजार में व्यापार गतिविधि की मात्रा दिखाता है। बढ़ती मात्रा का मतलब है कि अधिक व्यापार गतिविधि थी और पिछले दिन की तुलना में अधिक अनुबंध किए गए थे।
प्रवृत्तियों के दौरान, उच्च और बढ़ती मात्रा का मतलब है कि व्यापार गतिविधि चल रही प्रवृत्ति का समर्थन करती है और एक प्रवृत्ति निरंतरता की संभावना है क्योंकि अधिक निवेशक (या अधिक अनुबंध व्यापार) वर्तमान मूल्य आंदोलनों का समर्थन करते हैं। तकनीकी विश्लेषण संभावित रिवर्सल की पहचान करने के लिए वॉल्यूम सूचना का भी उपयोग करता है – यदि अपरिवर्तित वॉल्यूम की गिरावट के दौरान, और गति गिरती है, तो यह संकेत देता है कि कम लोग इस प्रवृत्ति में खरीद रहे हैं और दृढ़ विश्वास कम हो रहा है।
Open Interest
Open Interest describes the number of outstanding contracts at the end of any given day that has not been settled. Remember that for each buyer, you need a seller. Up until the moment that a buyer and a seller have been matched to “create a trade” the contract is considered “Open”.1 An increase in Open Interest shows that more traders want to enter a position. Especially immediately before a new trend or during strong trends, an increase in Open Interest indicates that a breakout is likely or that the trend will strengthen since more investors are looking to enter a trade.
If more investors become “interested” and are waiting for their orders to get filled, it can foreshadow the flow of money into a market and thus, provide information about investors’ sentiment.
Open Interest किसी दिए गए दिन के अंत में बकाया अनुबंधों की संख्या का वर्णन करता है जो तय नहीं किया गया है। याद रखें कि प्रत्येक खरीदार के लिए आपको विक्रेता की आवश्यकता होती है। उस पल तक जब एक खरीदार और विक्रेता को “व्यापार बनाने” के लिए मेल किया गया है, तो अनुबंध को “ओपन” माना जाता है .1 Open Interest में वृद्धि से पता चलता है कि अधिक व्यापारी एक स्थिति में प्रवेश करना चाहते हैं। विशेष रूप से एक नई प्रवृत्ति या मजबूत प्रवृत्तियों के ठीक पहले, Open Interest में वृद्धि से संकेत मिलता है कि ब्रेकआउट संभव है या प्रवृत्ति मजबूत होगी क्योंकि अधिक निवेशक एक व्यापार में प्रवेश करने की तलाश में हैं।
यदि अधिक निवेशक “रुचि रखते हैं” और अपने आदेशों को भरने की प्रतीक्षा कर रहे हैं, तो यह बाजार में पैसे के प्रवाह को पूर्ववत कर सकता है और इस प्रकार, निवेशकों की भावनाओं के बारे में जानकारी प्रदान करता है।
Price
When it comes to price, there are a few things that need to be taken into consideration when analysing charts:
- Momentum: Momentum describes how strong price moves in one direction. Do you see increasing and large candles only going in one direction, or is there a lot of opposition and back and forth?
- Volatility: Do candles show long shadows, or are candles mostly made up of bodies?
- Hurdles: Are strong support and resistance areas close by, or does Price have space to move?
Of course, this is a very simplified way of looking at price information, but this article has the purpose of breaking down the underlying components that drive the markets. A trader who can “read” and interpret volume, Open Interest and price information and understand that those three elements provide insights about investors’ activity and sentiment, can make much better trading decisions.
बेशक, यह कीमत की जानकारी को देखने का एक बहुत ही सरल तरीका है, लेकिन इस आलेख में अंतर्निहित घटकों को तोड़ने का उद्देश्य है जो बाजार चलाते हैं। एक व्यापारी जो Price Volume and Open Interest की जानकारी को “पढ़” और व्याख्या कर सकता है और समझ सकता है कि उन तीन तत्वों में गतिविधि और निवेशकों की भावना के बारे में अंतर्दृष्टि प्रदान की जाती है, इससे बेहतर व्यापार निर्णय ले सकते हैं।
If you liked this article, please share it on social networking. You can also find us on Twitter, Facebook, YouTube, Instagram, and Telegram.