Copper Poised for Bullish Breakout?
Copper Poised for Bullish Breakout? Testing Resistance But Uptrend Signals Remain
Copper Poised for Bullish Breakout?
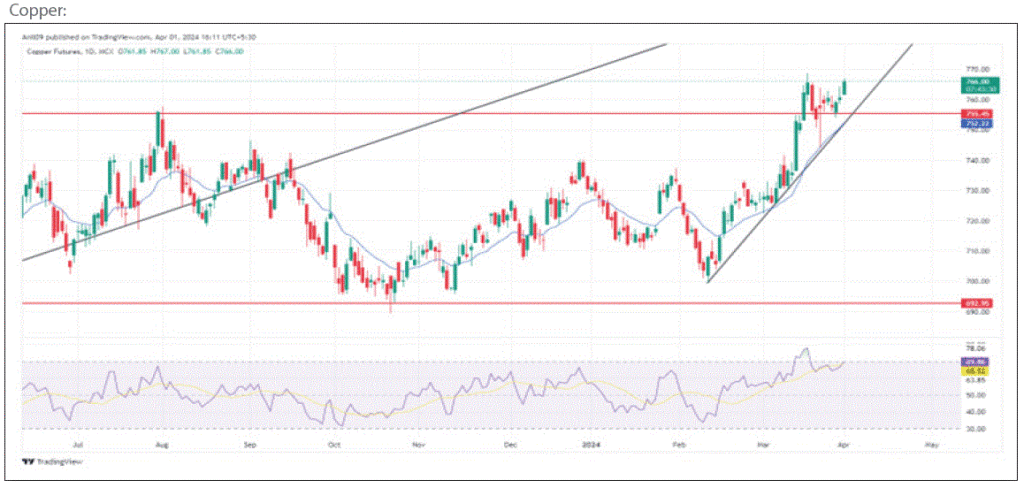
Copper’s daily chart paints a picture of a potential bullish breakout. Prices have been forming higher highs, currently testing the previous swing highs around $768.75. A decisive break above this crucial resistance level is vital for the uptrend to resume.

Technical Analysis Supports Bullish Outlook:
- Moving Averages: Copper comfortably sits above the short-term moving average (752), indicating a positive short-term trend. Additionally, the 760 level acts as immediate support.
- RSI: The Relative Strength Index (RSI) recently experienced a positive crossover in the oversold zone, suggesting momentum is shifting towards the upside.
- Price Action Strength: Notably, prices haven’t breached the previous day’s low for the past three sessions, further bolstering the bullish case.
Trading Strategy:
Based on the current technical landscape, a buy on dips strategy could be appropriate for the day. This strategy involves buying Copper when prices experience temporary pullbacks, targeting resistance levels of $768/$770.
Considerations for Informed Trading:
- Market Volatility: Unexpected economic news or geopolitical events could trigger market volatility, impacting Copper’s price movement.
- Supply and Demand: Global supply chain disruptions or changes in demand from key sectors like construction and electronics can affect Copper prices.
- Confirmation of Breakout: A decisive breakout above the $768.75 resistance level would solidify the bullish trend. Conversely, a sustained drop below $760 could signal a potential trend reversal.
Disclaimer: This analysis is for informational purposes only and should not be considered financial advice. Conduct your own research and due diligence before making any trading decisions.
If you liked this article, then please share it on the social networking site. You can also find us on Twitter, Facebook, YouTube, and Instagram, Telegram.


