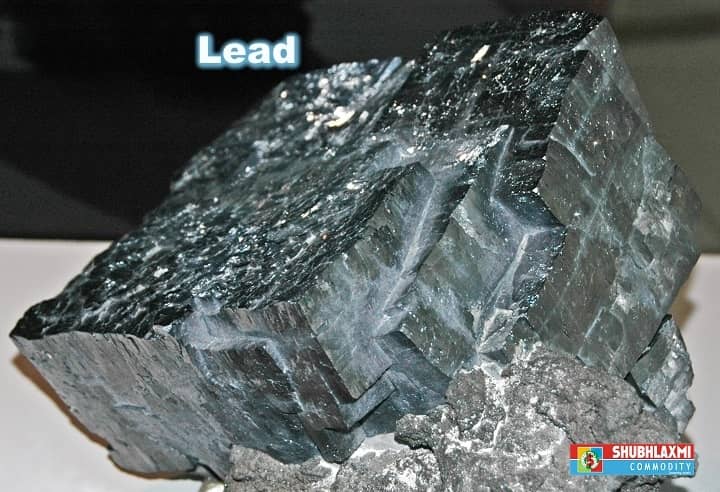
MCX Lead broken resistance line
Adjacent chart shows the price movement of MCX Lead continuous contract. Lead has witnessed a sharp recovery from the low ...
Read more

Adjacent chart shows the price movement of MCX Lead continuous contract. Lead has witnessed a sharp recovery from the low ...
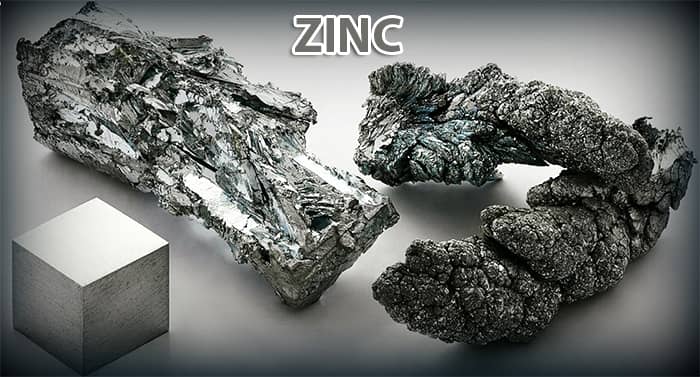
Read moreAdjacent chart shows the price movement of MCX Zinc continuous contract. MCX Zinc has witnessed a sharp pullback from the ...
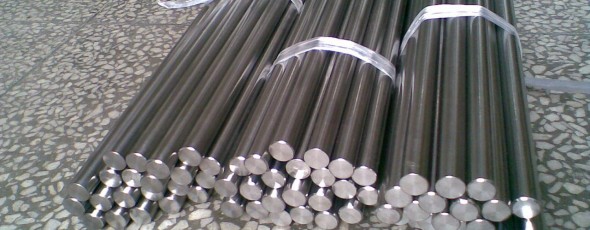
Read moreAdjacent chart shows the price movement of MCX Nickel continuous contract. Nickel is forming a triangle pattern as it is ...
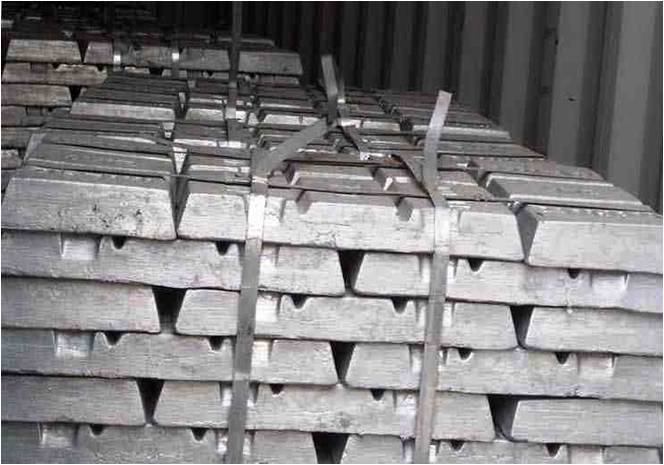
Read moreAdjacent chart shows weekly price movement of MCX Aluminium continuous contract. Aluminium managed to hold above a 78.6% retracement level ...
Read moreAdjacent chart shows the price movement of MCX Lead continuous contract. Lead witnessed a breakdown from the bear flag pattern ...
Read moreAdjacent chart shows the price movement of MCX Zinc continuous contract. Zinc closed in green after five days of negative ...
Read moreNYMEX Crude Oil is forming a lower top lower bottom pattern and is trading below the daily moving averages. In ...
Read moreAdjacent chart shows the price movement of MCX Nickel continuous contract. Nickel found resistance at the downward sloping trend line ...
Read moreBelow chart shows the price movement of MCX Zinc continuous contract. MCX Zinc Bears back in action Zinc is forming ...
Read moreGold is in a downtrend, as it is forming a ‘lower top lower bottom pattern’ and gold trading below its ...
Read more© 2008-2024 SHUBHLAXMI COMMODITY